Rating the Planet’s Oceans

The most comprehensive assessment conducted by the Ocean Health Index rates the Earth’s oceans at 67 out of 100 in overall health. In addition, for the first time, the report assessed the Antarctic and the 15 ocean regions beyond national jurisdiction (high-seas areas) — all critical regions for maintaining a healthy climate, safeguarding biodiversity and providing sustainable food sources.
In the third annual update of the index, a partnership led by scientists from UC Santa Barbara’s National Center for Ecological Analysis and Synthesis (NCEAS) and Conservation International (CI), the Antarctic and the Southern Ocean region scored 72, while the average score of the high seas was 67 out of 100. These distant areas had not been included in earlier assessments because they required additional data.
Together with the 220 exclusive economic zones (EEZs) measured in 2012 and 2013, the index now measures all of the oceans on planet Earth. The overall score for global EEZ, accounting for modification and updates of data and methods, was 67 in the first two years and 68 in 2014. These EEZs along with the inclusion of the high seas and Antarctica and the Southern Ocean assessments begin to provide a more complete picture of ocean health, even though most of those areas are not yet adequately studied.
“During our first two years, we were able to show the health of the oceans within 200 nautical miles of coastlines, but it was like doing a jigsaw puzzle where you put the edges together first,” said Ben Halpern, professor at UCSB’s Bren School of Environmental Science and Management and an NCEAS associate. “Filling in the rest of the puzzle with Antarctica and the high seas completes the picture and is a major step toward better understanding the state of our entire oceans.”
For the Antarctic and Southern Ocean the eight goals assessed were Food Production (55), Natural Products (29), Coastal Protection (99), Economies and Livelihoods (83), Tourism and Recreation (55), Sense of Place (46), Coastal Protection (99), Clean Water (100) and Biodiversity (94).
“The Antarctic’s biodiversity score of 94 out of 100 is encouraging, but it is based on data from only 132 species that have been formally assessed,” said Catherine Longo, project scientist at NCEAS and lead scientist of the Antarctica assessment.
“Antarctica and the Southern Ocean are protected by distance from many of the threats caused by human populations, such as chemicals, excessive nutrients, and pathogens and trash,” noted Greg Stone, chief scientist and executive vice president of the Moore Center for Science and Oceans at Conservation International. “That’s why we see a very high score in a goal like Clean Water.”
“The score of 100 that is set as a target for each goal reflects a status that is feasible to achieve and can sustainably produce maximum benefits now and in the future,” added Steve Katona, managing director for the Ocean Health Index. “Any score below 100 means there is room for improvement.”
The high seas assessment included three goals and subgoals: Fisheries, Iconic Species and Biodiversity (measured as the threat of extinction to all assessed species). “The high seas are home to important fisheries for species such as tuna and provide habitat or migratory pathways for iconic species such as whales, sharks and sea turtles,” said Elizabeth Selig, conservation scientist with CI and the lead scientist on the high-seas assessment. “Like the Antarctic assessment, the vast size and remoteness of the high seas has limited our ability to study all of the habitats and organisms present, so the biodiversity scores for these regions were based only on species whose populations have been formally assessed.”
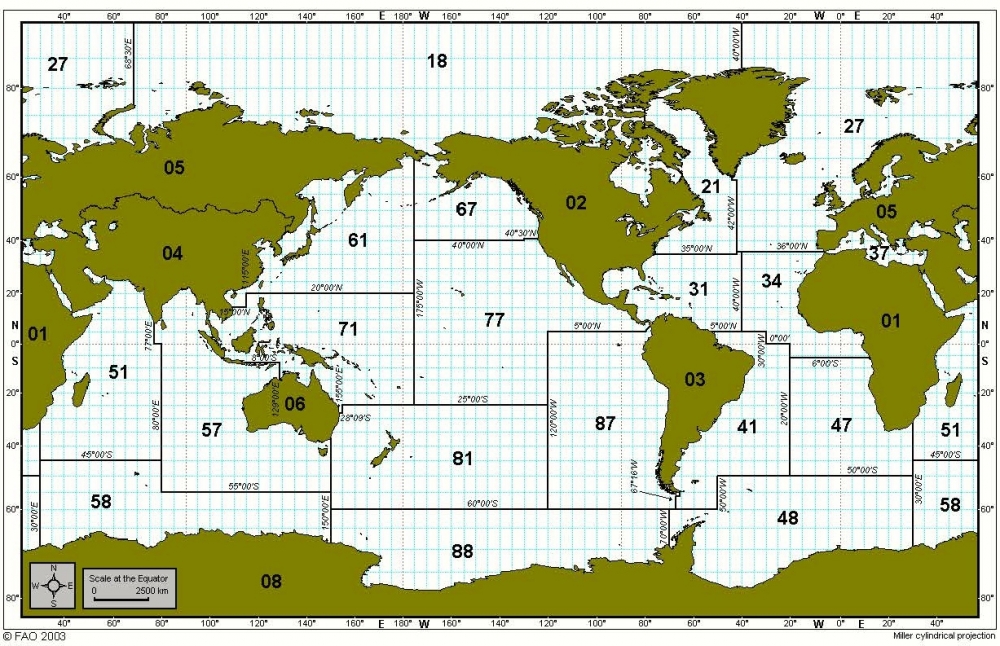
The Western Indian Ocean and Eastern Central Atlantic Ocean scored highest overall at 79 and the Northwestern Pacific Ocean scored lowest at 53. The Eastern Central Atlantic Ocean had a Fisheries score of 81 out of 100, followed by the Western Indian Ocean with 80, making them the highest-scoring sectors for fisheries. At 7, the Northwestern Pacific Ocean had the lowest Fisheries score because, among other things, its stocks were farthest from the biomass that provides maximum sustainable yield.
In addition to this third global update of the Ocean Health Index, two regional assessments were issued this year: one that evaluated ocean health of Brazil’s 17 coastal states and a second measuring the health of the United States West Coast. The next global assessment is planned for September 2015.
Share this article
Related Stories


