Expanding Renewable Energy Planning


While the world is eager for more renewable energy, a lot of planning has to happen before we can erect turbines or install solar cells at any large scale. This used to require months of extensive study by expert researchers, but a new collaboration between UC Santa Barbara and the World Bank empowers stakeholders themselves to conduct this analysis for any country in the world.
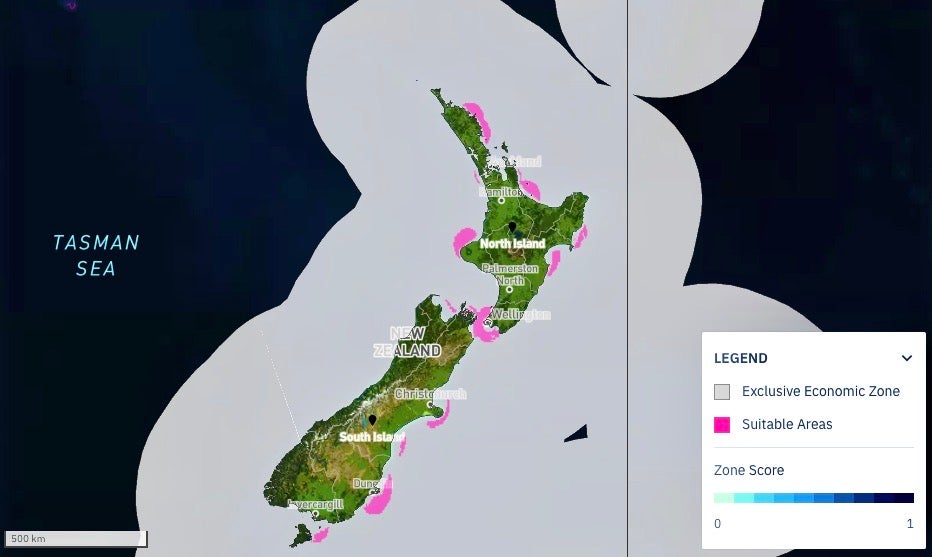
The REZoning web tool — short for Renewable Energy Zoning — conducts geographic and economic analyses based on users’ preferences within minutes, with no technical knowledge required. “It helps people figure out where to build future wind and solar powerplants using the criteria that are most important to them,” said technical co-lead Grace Wu, an assistant professor in the Environmental Studies Department at UCSB. The software product enables stakeholders to replicate analyses on the fly that used to take specialists months to complete. Within minutes REZoning can create maps, figures and myriad downloadable geospatial outputs.
The REZoning tool was developed by the Energy Sector Management Assistance Program (ESMAP) in partnership with UCSB and Derilinx. It is part of the global ESMAP initiative on Renewable Energy Resource Mapping that includes biomass, small hydropower, solar energy, and wind energy. The tool uses geographic and meteorological models, calibrated with real-world data, that simulate wind speed and solar radiation across the Earth’s surface. REZoning sources its data from the Global Wind Atlas and Global Solar Atlas — two ESMAP-funded projects that are free and publicly available. Other datasets include protected areas, forest cover, cropland, nature reserves and more, which were provided by several other agencies.
By combining all these factors, the software can determine the most suitable sites for wind and solar development in a given region. “This tool allows the user to set up their own constraints, their own filters on what to include and what not to include,” said technical co-lead Ranjit Deshmukh, also an assistant professor of environmental studies.
The REZoning tool uses methods developed under the Multi-criteria Analysis for Planning Renewable Energy (MapRE) initiative started by Wu and Deshmukh during their time at Berkeley Lab. Further, the version released by the World Bank drew its inspiration from a web-based tool developed by Anagha Uppal, a graduate student in Deshmukh's Clean Energy Transformation Lab (CETlab) at UC Santa Barbara.
“It was an exciting project idea,” said project lead Clara Ivanescu, a geographer at the World Bank’s Geospatial Operational Support Team. “Having worked with MapRE myself, I always thought that there should be an easier way to run this analysis while also enabling less experienced GIS users to do it. After brainstorming with my colleagues and our partners at UCSB, we came up with the idea of transferring this analysis to the cloud.”
In addition to the suitability analysis, the REZoning web tool can conduct an economic analysis of potential energy development. “Users can input the capital cost for equipment, transmission and road costs, and the tool will estimate the cost to generate wind and solar electricity from each of those potential sites,” Deshmukh said.
And REZoning can do even better than that. There are many factors aside from cost and solar and wind resources to consider when developing renewable energy. Criteria like topography, possible environmental impacts and the proximity to infrastructure and population centers all matter in the decision-making process. But with distances in miles and costs in dollars, it can be difficult to directly compare different factors.
That’s why Deshmukh and Wu incorporated a multicriteria analysis into the tool. “We can give different weights to each of these different criteria and come up with an overall zone score,” Deshmukh explained. Researchers used to assign weights based on their own analysis. However, because the software is open-source, stakeholders around the world can develop a consensus on how to rate different criteria. “That is the beauty of this tool,” he added, “it opens up the whole planning process to all stakeholders.”
Indeed, this was a major goal for the researchers and the World Bank. Typically, experts would conduct bespoke studies for each region, which could take several months or longer. “We wanted to develop a tool that could be used over and over again because this application has a lot of interest globally,” Wu said.
So, the team created a desktop version of the tool that standardized the analysis in 2016. The World Bank was immediately drawn to this tool because they had also been taking a study-by-study approach to renewable energy planning, a tactic that simply was not scalable.
That said, using the desktop tool involved extensive knowledge of GIS software. “The challenge was to translate something that required multiple steps and a lot of user intervention at various stages into a really straightforward set of inputs,” Wu said. The tool also had to cut the run time from hours to about five minutes.
The development team streamlined the interface and analysis to create a more intuitive package. The web tool also has access to the processing power of remote servers, rather than a single computer, and isn’t subject to the specs of different users’ PCs. The outcome is a tool anyone can use that can produce results within minutes.
“As part of our ongoing work on development of different GIS visualization tools, we developed REZoning to provide project developers, government officials, regulators, utilities and other stakeholders with a dynamic, multi-criteria ranking tool,” said Tigran Parvanyan, an energy specialist at Word Bank’s ESMAP. “The system can help assess possible renewable energy zones and seek to improve the planning of low-carbon, cost-effective, socially and environmentally responsible energy systems.”
“One of the benefits of this web tool is the ability for non-technical staff to be able to produce maps really quickly,” Wu said, “and be able to interact with the information in a way that they wouldn’t have if it were in a static form, like a report.”
“We need to take a much broader perspective, and a more inclusive perspective, on planning renewable energy projects,” she added, “and this tool is meant to facilitate that process.”
Share this article
Related Stories


